Market Education4 min read
Market breadth: what it can and cannot tell you
Learn how advance–decline counts and participation measures add context to index moves—and why market breadth indicators are not standalone signals.
By TerraTrade Team
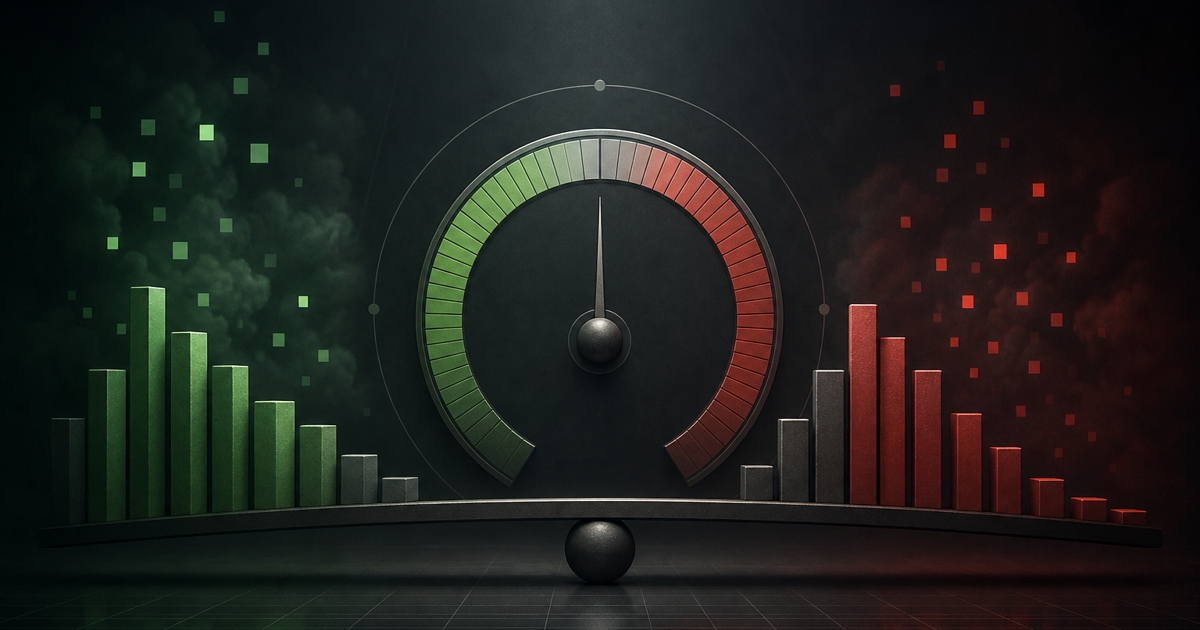
What market breadth measures#
Common advance–decline views#
| Measure | What it summarizes | Useful question | What it does not establish |
|---|---|---|---|
| Advancing, declining, and unchanged issues | Counts of securities in each category over a stated period. Advance-Decline Indicators | ChartSchool | StockCharts.com | How many counted issues rose, fell, or were unchanged? | Whether a particular move will continue or reverse. |
| Net advances | Advancing issues minus declining issues. Advance-Decline Indicators | ChartSchool | StockCharts.com | Was the count of advancers greater or smaller than decliners? | The size of each stock’s move or the reason it moved. |
| Cumulative advance–decline line | A running total of net advances. Advance-Decline Indicators | ChartSchool | StockCharts.com | Has the cumulative count been moving with the index? | A guaranteed confirmation or reversal signal. Advance decline indicator | Market breadth | Fidelity |
| Advancing versus declining volume | Trading volume associated with advancing issues compared with declining issues. Advance-Decline Indicators | ChartSchool | StockCharts.com | Was more of the measured volume associated with advancing or declining issues? | How every trader acted or what the next price move will be. |
Use breadth as market context#
- Name the universe. Is the reading based on NYSE-listed issues, constituents of a particular index, or another defined set? Do not assume the label alone specifies it.
- Identify the calculation. Is it an issue count, net advances, a cumulative line, or a volume-based measure? These readings are not interchangeable. Advance-Decline Indicators | ChartSchool | StockCharts.com
- Match the time interval. Compare like with like—for example, a daily breadth reading with the corresponding daily index context.
- Describe what you see before interpreting it. Record whether breadth is rising, falling, or diverging from the index, without treating the observation as a prediction.
- Check price and your own setup rules separately. Use breadth as additional context, not as an entry, exit, or risk rule unless that use has been explicitly defined and tested.
- Review results by period and assumptions if you test a breadth condition. A historical relationship does not establish that the same relationship will persist.
Strengths and limitations
Strengths
- ✓Adds a participation view alongside index price.
- ✓Can highlight differences between an index’s path and the behavior of a selected group of issues.
- ✓Offers several distinct views, including issue counts and volume-based measures. (Source: Advance-Decline Indicators | ChartSchool | StockCharts.com)
Limitations
- —The reading depends on the securities included, the interval, and the calculation.
- —Breadth can fail to confirm an index trend or forecast a reversal. (Source: Advance decline indicator | Market breadth | Fidelity)
- —Published predictive results are conditional on their sample, definitions, and trading assumptions.
The practical takeaway#
Frequently asked questions#
What does an advance–decline indicator measure?
It describes how many securities in a defined universe advanced, declined, or remained unchanged over a stated period. Some versions count issues; others compare volume associated with advancing and declining issues. Advance-Decline Indicators | ChartSchool | StockCharts.com
What can market breadth tell an index trader?
It can show whether the index’s move coincided with gains or losses across many issues in the selected universe. It does not prove why the move happened or predict what comes next.
Does weak breadth mean an index must reverse?
No. Fidelity notes that advance–decline readings may not always confirm trends or forecast reversals. Treat a divergence as a descriptive difference to investigate, not a guaranteed turning point. Advance decline indicator | Market breadth | Fidelity
Why can two breadth readings disagree?
Check the universe, calculation, and time interval. An issue count and a volume-based measure summarize different things, and readings from different universes should not be assumed to be comparable. Advance-Decline Indicators | ChartSchool | StockCharts.com
Is breadth of ownership the same as advance–decline breadth?
Not directly. Breadth of ownership concerns the number of investors holding a long position in an individual stock; it is a different concept from an advance–decline count of market issues. Breadth of ownership and stock returns - ScienceDirect
Sources#
- https://www.nyse.com/trade/reports/rule-605 — nyse.com
- https://www.nyse.com/market-status/history — nyse.com
- https://www.sec.gov/data-research/market-structure-data — sec.gov
- Advance-Decline Indicators | ChartSchool | StockCharts.com — chartschool.stockcharts.com
- Advance decline indicator | Market breadth | Fidelity — fidelity.com
- Market Breadth, Trin Statistic,and Market Returns | Portfolio Management Research — doi.org
- Breadth of ownership and stock returns - ScienceDirect — sciencedirect.com
- https://www.sciencedirect.com/science/article/pii/S0264999319312982 — sciencedirect.com
- https://link.springer.com/article/10.1007/s10598-026-09751-2 — link.springer.com
- https://pmc.ncbi.nlm.nih.gov/articles/PMC3992521/ — pmc.ncbi.nlm.nih.gov
- https://www.nber.org/papers/w30217 — nber.org
- https://www.sciencedirect.com/science/article/pii/S1057521916301053 — sciencedirect.com
- https://escholarship.org/uc/item/6x49x543 — escholarship.org
- https://stars.library.ucf.edu/etd/3280/ — stars.library.ucf.edu
- https://tradersweek.com/research/articles/walk-forward-breadth-timing — tradersweek.com
- https://doi.org/10.1016/j.jbankfin.2020.105966 — doi.org
KEEP READING
Market Education10 min read
A pre‑earnings risk checklist for active traders
A practical, source‑driven pre‑earnings checklist: confirm dates on EDGAR, audit 10‑Q risk updates, scenario‑plan gaps, and decide catalyst vs ordinary setups.
Read post
Market Education11 min read
Use an economic calendar as a risk tool
Intraday traders can’t predict data or first reactions, but they can schedule risk. Use official calendars to plan size and execution around known volatility.
Read post
Strategies11 min read
Dealer Gamma, 0DTE, and Expiry Pin Risk Explained
Plain-language definitions of dealer gamma and 0DTE, how expiry can look like pinning, and a vendor-agnostic, invalidatable test you can run.
Read post