Strategies9 min read
Make Support and Resistance Rules Measurable
Build repeatable support and resistance strategy rules with objective pivots, explicit zone tolerance, setup definitions, and a reproducible test plan.
By TerraTrade Team
Why make levels measurable#
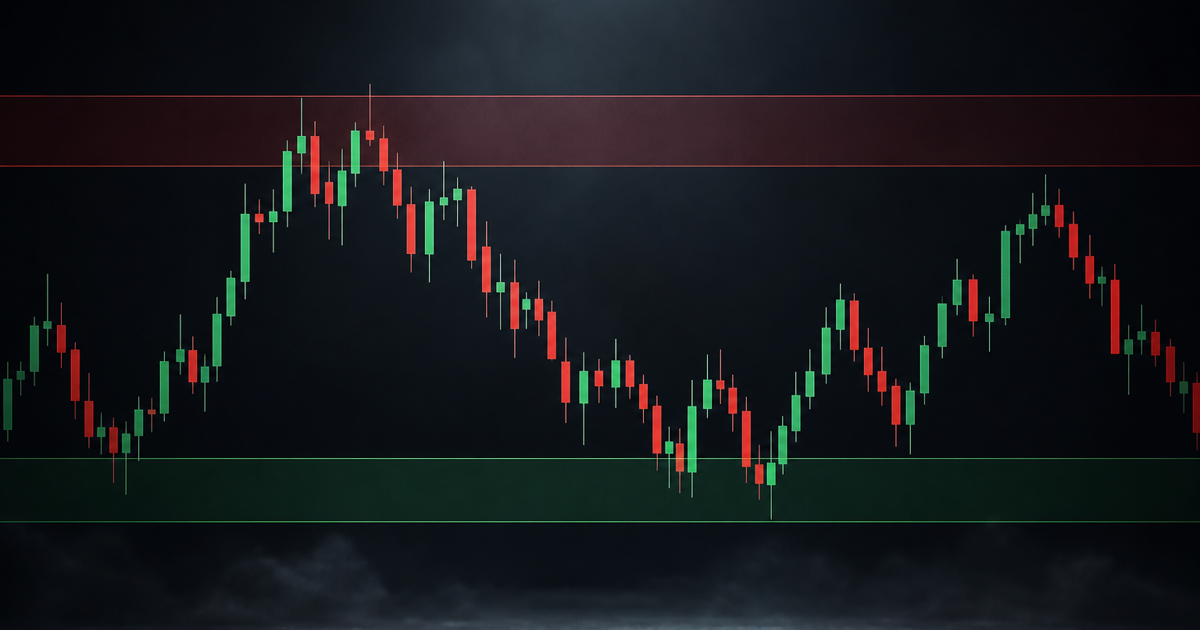
A support line can look obvious after price has bounced from it. The harder question is whether you could have drawn the same level, at the same time, using only information that was then available. That is the test behind support and resistance strategy rules: turn a visual impression into a repeatable procedure.
A level is a price reference, not a guarantee that price will reverse. Evidence from a New York Fed article on dealer- and newsletter-published FX levels reported more intraday interruptions near those levels than near arbitrary prices in its sample, with variation across providers and currency pairs. That evidence is specific to those signals, markets, and dates; it does not establish a universal effect or a profitable strategy. https://www.researchgate.net/publication/5050393_Support_for_Resistance_Technical_Analysis_and_Intraday_Exchange_Rates
The goal here is not to prescribe winning parameters. It is to define a complete, falsifiable setup: how a level is constructed, when it becomes usable, how wide its zone is, what counts as a touch or a break, and what you would record in a test.
Write the rules before drawing#
Before charting examples, write down the choices that can otherwise shift from one chart to the next. Keep the instrument, data source, bar interval, and trading session consistent within a test. For a first pass, daily bars are often easier to inspect than tick data; an intraday test needs session and timestamp rules as well.
Use a compact rule sheet like this. The example pivot is a possible method, not a validated parameter set; choose its lookback and zone width in advance, then test alternatives without changing the rules after seeing outcomes.
| Rule component | A testable definition | Why it matters |
|---|---|---|
| Input data | Name the instrument, price field, bar interval, session, and adjustment method. | Different data choices can produce different highs, lows, and apparent touches. |
| Pivot candidate | For example, define a swing low as a bar whose low is below the lows of a fixed number of bars on both sides; reverse the comparison for a swing high. | A fixed rule replaces choosing convenient turning points by eye. |
| Availability time | A pivot requiring bars to its right is not known until those bars have closed. | Using it earlier creates look-ahead bias. |
| Level grouping | Specify how candidate prices are merged into a band, and how long a level remains active. | Prevents nearby prices being combined selectively after the outcome. |
| Touch and outcome | Define contact, rejection, and break using fixed price or bar-close conditions and a fixed observation window. | Makes the measured event comparable from trade to trade. |
A straightforward construction process makes the timeline explicit. Keep a record of when a candidate is first visible and when it becomes eligible for a trade hypothesis.
- Choose the market, bar interval, session, and price series. Decide whether the setup uses highs and lows, closes, or another field, and use that choice consistently.
- Mark candidate pivots mechanically. One option is a fixed left-and-right bar count: a swing low must be lower than the specified neighboring lows, and a swing high higher than the neighboring highs.
- Wait for confirmation. If the rule needs bars after the candidate, the level becomes available only after those bars have completed. Do not backdate it to the pivot bar.
- Convert candidates into zones with a declared rule. For example, group prices within a chosen distance measured in ticks, percentage, or a volatility-scaled unit. State whether the zone is centered on a pivot, based on a price cluster, or defined another way.
- Set an expiry or reset rule. A level might stop being active after a fixed number of bars, after a confirmed close beyond it, or at a session boundary. Pick one rule before testing.
- Apply the same touch definition every time. Specify whether an intrabar wick into the band counts, whether a close inside counts, and whether repeated bars in one visit are one test or several.
- Label the subsequent outcome within a fixed horizon. For example, define rejection as price moving a preselected distance away before a preselected break condition. Define a break independently, such as a bar close beyond the far edge. Record cases that meet neither condition as unresolved or time-expired.
A single exact price can make a chart look more precise than the underlying idea. But a wide zone can capture more price action simply because it covers more prices. Treat tolerance as a model choice, not a cosmetic adjustment.
State how the zone width is calculated and keep that method fixed during each test. A tick-based width is easy to interpret but may not compare well across instruments. A percentage width scales with price, while a volatility-based width changes with recent movement; those alternatives introduce their own assumptions. Avoid choosing whichever width encloses the historical reactions most neatly.
An FX study constructed levels using clustering methods and tested them on EUR/USD data—an example of operationalizing level construction. Results from that setting should not be generalized automatically to other markets or timeframes. https://www.aimspress.com/article/doi/10.3934/NAR.2020021?viewType=HTML
A useful comparison tests a small, predeclared set of widths against the same level-generation and outcome rules. Report how many events each width captures, how often events resolve as rejection, break, or timeout, and how sensitive the result is to modest parameter changes. If a narrow parameter tweak reverses the conclusion, treat the hypothesis as fragile.
Define the setup, entry, and exit hypothesis#
A level by itself is not a complete strategy. Specify the trigger, invalidation, and exit hypothesis separately. The following is a research template for a possible support-rejection setup, not a recommendation or a claim of profitability.
Make the trigger and execution assumptions observable in historical data. If the test depends on discretionary confirmation—such as “strong rejection”—replace that phrase with a rule or label it as a manual judgment to be evaluated separately.
- Setup: A previously confirmed support zone is active under the prewritten pivot and expiry rules. Price returns to the zone after moving away from it. Define “returns” and whether a level with prior tests remains eligible.
- Entry hypothesis: Evaluate a long entry only after a specified response condition, such as a bar closing back above the zone after trading into it. Model execution at the next available bar or another explicitly stated price; do not assume a fill at the signal close unless that is the tested execution rule.
- Invalidation hypothesis: Define the condition that says the rejection idea has failed, such as a close below the far edge of the zone. Separately state the modeled risk exit and how gaps or fast moves are handled. A chart condition and a real stop fill are not necessarily the same price.
- Exit hypothesis: Test a predeclared exit method, such as a fixed holding horizon, an opposing precomputed zone, or a fixed risk multiple. These are alternatives to compare, not targets. Include fees, spread, slippage, and any relevant financing or contract costs in the test assumptions.
- Mirror case: For resistance, reverse the direction and state equivalent trigger, invalidation, and exit rules before evaluating results. Do not assume the two sides behave symmetrically.
Use this plan to evaluate whether the defined behavior is repeatable and whether a trade hypothesis survives realistic assumptions. Evidence that a level precedes interruptions is not the same as evidence that a strategy earns excess returns after costs. One study of published FX levels found predictive behavior in its specific sample, while outcomes varied across providers and currency pairs. https://www.researchgate.net/publication/5050393_Support_for_Resistance_Technical_Analysis_and_Intraday_Exchange_Rates
- Freeze the full specification: data source, pivot rule, confirmation delay, zone method and width, expiry, touch count, trigger, invalidation, exits, and execution assumptions.
- Create levels only from information available at each historical timestamp. Keep unconfirmed pivots out of the active-level set.
- Run the rule across a defined sample. Split development and evaluation periods, or use a walk-forward design, and avoid repeatedly tuning against the same evaluation data.
- Track each eligible level test, not just trades taken. Record rejection, break, timeout, entry eligibility, modeled fill, costs, and the reason for any exclusion.
- Compare the setup with a suitable baseline and inspect results by instrument, timeframe, volatility regime, and long/short side where sample size permits. Treat small or uneven groups cautiously.
- Test sensitivity to the predeclared tolerance values and reasonable execution assumptions. Show whether conclusions persist outside the single best-looking combination.
- Review out-of-sample observations and replay examples with the written rules visible. Log rule ambiguity and revise only in a new test version.
Use controlled tags so results can be grouped without relying on memory. Keep tags descriptive: “zone-width-0.25%” is more useful than “good level.” Store the rule version alongside each test so changes do not silently mix unlike setups.
- Construction version and pivot lookback
- Zone-width method and value
- Support or resistance; instrument and timeframe
- First test versus repeated test
- Touch, rejection, break, or timeout
- Trigger met; entry and fill assumption
- Invalidation type and exit method
- Regime or session label, if defined in advance
- Rule-followed, ambiguous, or excluded—with reason
Objective rules improve testability; they do not guarantee that the underlying hypothesis is useful.
Strengths and limitations
Strengths of a rule-based approach
- ✓Fixed construction and timing rules reduce hindsight and make chart reviews easier to reproduce.
- ✓Explicit zone widths and event definitions let you compare alternatives rather than rely on visual preference.
Limitations
- —A mechanical rule can miss context or encode arbitrary parameters; consistency alone does not demonstrate an edge.
- —Results may depend on instrument, timeframe, data quality, execution assumptions, and the chosen evaluation period.
Make the drawing reproducible#
The practical shift is from “that level looks important” to “this rule marked a zone at this time, and this predefined event followed.” Define what the data can reveal, prevent future bars from leaking into past decisions, and test tolerance without selecting only the best-looking chart. That process cannot promise a profitable result, but it can show whether your support-and-resistance hypothesis is clear enough to evaluate honestly.
Frequently asked questions#
Is support or resistance a line or a zone?
No. A line is one exact price; a zone is a defined band around or between prices. A zone can better represent tolerance, but its width must be specified and tested rather than adjusted after seeing the chart.
When is a pivot-based level available?
Only after all required confirmation data is available. If a pivot rule uses bars to the right of the candidate, the level cannot be treated as known until those bars have closed.
What is the best tolerance for a level?
No single tolerance is established here as universally optimal. Treat width as a model choice and test a small, predeclared set against the same construction and outcome rules.
Does a support or resistance touch predict a reversal?
No. Evidence from particular markets and samples is context-bound. A studied set of published FX levels identified interruptions in its sample, with variation across firms and currency pairs; that is not a universal profitability finding. https://www.researchgate.net/publication/5050393_Support_for_Resistance_Technical_Analysis_and_Intraday_Exchange_Rates
What should I journal for each test?
Record the level rule version, zone width, touch outcome, trigger, entry assumption, invalidation, exit, costs, and whether the rules were followed. Consistent tags make later comparisons more reliable.
Sources#
- https://www.federalreserve.gov/econres/feds/monetary-policy-and-the-predictability-of-nominal-exchange-rates.htm — federalreserve.gov
- https://moneyweek.com/investments/investment-strategy/is-technical-analysis-chartism-dead — moneyweek.com
- https://www.newyorkfed.org/research/staff_reports/sr125.html — newyorkfed.org
- https://www.fedinprint.org/item/fednep/19790 — fedinprint.org
- https://www.researchgate.net/publication/5050393_Support_for_Resistance_Technical_Analysis_and_Intraday_Exchange_Rates — researchgate.net
- https://www.newyorkfed.org/medialibrary/media/research/epr/00v06n2/0007osle.pdfTechnical — newyorkfed.org
- https://www.aimspress.com/article/doi/10.3934/NAR.2020021?viewType=HTML — aimspress.com
- https://fraser.stlouisfed.org/files/docs/publications/frbnysr/frbny_sr125.pdf — fraser.stlouisfed.org
- https://www.sciencedirect.com/science/article/pii/S1042443105000508 — sciencedirect.com
- https://doi.org/10.1002/ijfe.288 — doi.org
- https://www.sciencedirect.com/science/article/pii/S0264999301000670 — sciencedirect.com
- https://www.sciencedirect.com/science/article/pii/S0165188926001673 — sciencedirect.com
- https://jurnal.darmajaya.ac.id/index.php/jmmd/article/view/890 — jurnal.darmajaya.ac.id
- https://papers.ssrn.com/sol3/papers.cfm?abstract_id=7484 — papers.ssrn.com
- https://www.newyorkfed.org/medialibrary/media/research/epr/1996/EPRvol2no2.pdf — newyorkfed.org
- https://ideas.repec.org/p/fmg/fmgdps/dp142.html — ideas.repec.org
KEEP READING

Strategies7 min read
How to Calculate a Stock Gap After a Split
Learn how to calculate a stock gap percentage after a split by aligning price basis, checking corporate-action dates, and recording inputs consistently.
Read post
Strategies8 min read
How to Calculate a Pairs-Trading Spread
Learn how to calculate a pairs-trading spread: align price data, estimate a training-only hedge ratio, calculate residuals, and audit units.
Read post
Strategies7 min read
How to Calculate Session VWAP From OHLCV Data
Build session VWAP from historical OHLCV bars in a spreadsheet, with cumulative formulas, a worked example, and data-quality checks.
Read post