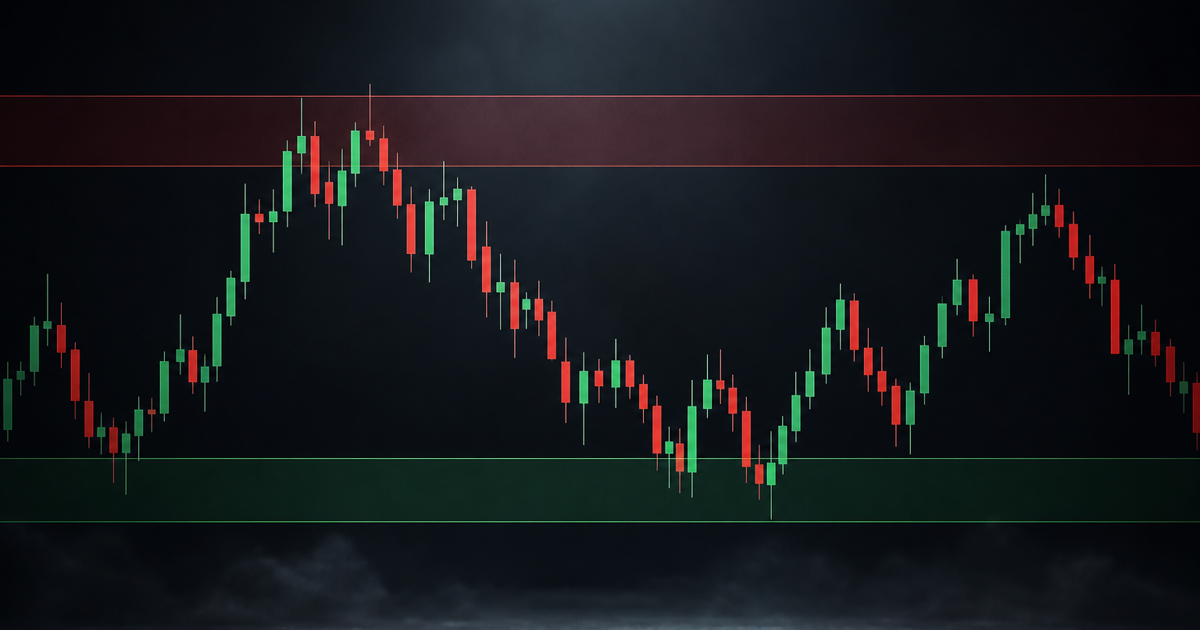
Candlestick chart with horizontal support and resistance zones marked across recent price swings

Strategies9 min read

Make Support and Resistance Rules Measurable

Build repeatable support and resistance strategy rules with objective pivots, explicit zone tolerance, setup definitions, and a reproducible test plan.

Read post
A stock exchange opening bell beside a screen showing an upward price chart.

Strategies7 min read

How to Calculate a Stock Gap After a Split

Learn how to calculate a stock gap percentage after a split by aligning price basis, checking corporate-action dates, and recording inputs consistently.

Read post
Two price series and a separate residual chart illustrating a spread calculation.

Strategies8 min read

How to Calculate a Pairs-Trading Spread

Learn how to calculate a pairs-trading spread: align price data, estimate a training-only hedge ratio, calculate residuals, and audit units.

Read post
Intraday candlestick chart and volume bars displayed on a trading screen

Strategies7 min read

How to Calculate Session VWAP From OHLCV Data

Build session VWAP from historical OHLCV bars in a spreadsheet, with cumulative formulas, a worked example, and data-quality checks.

Read post
Stock exchange trading floor at the opening bell with market screens in the background

Strategies8 min read

How to Test a Time Stop for Intraday Trades

Test an intraday time stop against unchanged price exits with a practical worksheet for net P&L, MAE, MFE, and execution costs.

Read post
Chalkboard-style gamma curve annotated with positive and negative zones, no logos

Strategies11 min read

Dealer Gamma, 0DTE, and Expiry Pin Risk Explained

Plain-language definitions of dealer gamma and 0DTE, how expiry can look like pinning, and a vendor-agnostic, invalidatable test you can run.

Read post
A candlestick chart around the 09:30 opening bell highlighting a visible upside price gap and early continuation, no logos.

Strategies6 min read

A disciplined way to backtest gap-and-go setups

Backtest the gap and go strategy without hindsight: define universe, time‑stamp catalysts, model the opening auction, and predeclare entries and exits.

Read post
A price chart dips below an average line and then reverts back toward it.

Strategies9 min read

Mean reversion without catching every falling knife

A practical mean‑reversion setup: apply regime, extension, liquidity, and invalidation filters with OU or z‑score bands and a reproducible test plan.

Read post
Uptrend chart with pullbacks marked by Fibonacci retracements and ATR‑based stops.

Strategies8 min read

How to test a trend-pullback strategy

Turn a vague pullback idea into a testable trend pullback strategy with measurable rules, ATR/Fibonacci options, and a reproducible backtest plan.

Read post
A multi-monitor trading desk showing an intraday stock chart with a VWAP line overlaid.

Strategies10 min read

VWAP strategy setups and when they fail

A practical VWAP strategy guide for intraday traders—three setups, explicit invalidation, and a reproducible backtest plan.

Read post
Opening bell scene with an intraday chart showing a breakout from the first 15-minute range.

Strategies7 min read

Opening range breakout: rules, filters, and a test plan

A practical opening range breakout strategy guide: define range, triggers, invalidation, filters, and a falsifiable backtest before risking capital.

Read post
Overhead view of a tidy desk with a trading notebook of setup cards alongside printed candlestick charts

Journaling10 min read

Turn your best trades into a trading playbook

Turn recurring journal tags into explicit setup cards, review them on a spaced schedule, and backtest with controls to avoid overfitting.

Read post

Reading about edges is not an edge.

The journal does the measuring for you — connect a broker and see what your own numbers say.