Backtesting11 min read
Walk‑forward testing in plain English
A practical guide to walk forward analysis trading: rolling fit/test windows, parameter stability, and decision rules that avoid leakage.
By TerraTrade Team
What walk‑forward analysis does—without the jargon#
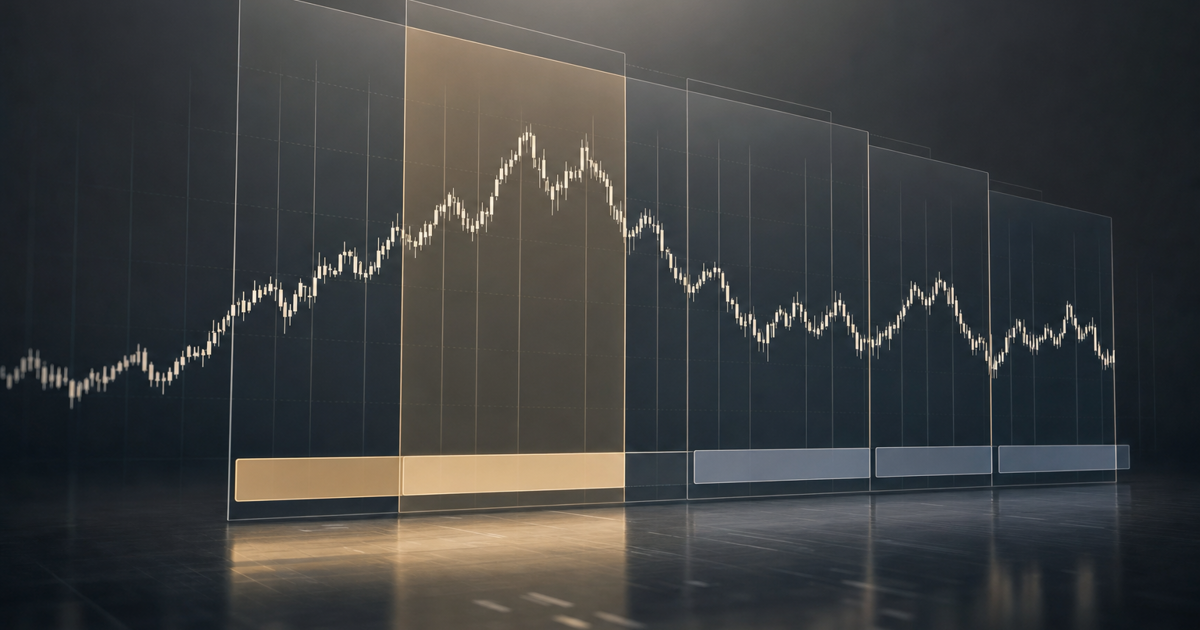
Walk‑forward analysis (WFA) is a time‑aware way to validate a trading strategy: you repeatedly fit your rules or model on data available up to a point in time, then test it on the immediately following period, and keep rolling forward. Each evaluation block is out‑of‑sample because it was never seen during fitting, and stitching those blocks together simulates how the strategy would have been retrained and deployed in real time Walk forward optimizationWalk-Forward Analysis for Trading Strategies | Backtest.aiWhat is walk-forward analysis? | Lagias. This approach is also described as walk‑forward optimization/validation or rolling‑origin time‑series cross‑validation Walk forward optimizationTime series cross-validation: an R example – Rob J HyndmanCross-Validation for Time Series, Explained | Quant Memo. For traders, walk‑forward analysis provides many out‑of‑sample periods rather than a single lucky split, helping you gauge robustness across regimes Walk forward optimizationWalk-Forward Analysis for Trading Strategies | Backtest.aiTime series cross-validation: an R example – Rob J Hyndman.

The three knobs: train length, test horizon, step#
Three knobs define any walk‑forward plan:
- Train length (W): how much past data you allow the fit to see before each test. Prefer time‑based (calendar/trading) windows (e.g., “3 years of daily bars”) rather than raw row counts Time series cross-validation: an R example – Rob J HyndmanTime Series Cross-Validation: Techniques & Implementation.
- Test horizon (H): how long you hold the fitted parameters fixed while you simulate trading and evaluate (e.g., “1 month,” “1 week”) Walk-Forward Analysis for Trading Strategies | Backtest.aiTime series cross-validation: an R example – Rob J Hyndman.
- Step (S): how far you advance the windows each iteration. You can step by H (non‑overlapping tests) or by a smaller stride for denser evaluation; keep the ordering strictly time‑forward Time series cross-validation: an R example – Rob J HyndmanTime Series Cross-Validation: Techniques & Implementation.
Rolling vs expanding (growing) windows#
Build a walk‑forward plan: a practical checklist#
- State the trading decision and horizon. Define what is predicted or triggered (e.g., next‑day direction, weekly breakout) and how often you can realistically retrain Time series cross-validation: an R example – Rob J HyndmanCross-Validation for Time Series, Explained | Quant Memo.
- Freeze your data pipeline. All feature engineering, normalization, and label building must be fit within each train window only, never on future data Cross-Validation for Time Series, Explained | Quant MemoTime-Series Cross-Validation Explained | Quantitative Finance | BondStats.
- Choose window scheme and sizes. Start with two or three plausible (W, H) pairs consistent with your horizon (e.g., W=3y/H=1m; W=18m/H=2w) and pick rolling vs expanding based on how quickly the market context changes Walk-Forward Analysis for Trading Strategies | Backtest.aiBacktesting Quantitative Trading Strategies: From Research Bias to Production Reality | Ernie’s Leisure CodeTime series cross-validation: an R example – Rob J Hyndman.
- Set the step S and retrain cadence. Non‑overlapping tests (S=H) are simplest; overlapping can increase the number of out‑of‑sample observations but demands careful bookkeeping Time series cross-validation: an R example – Rob J HyndmanTime Series Cross-Validation: Techniques & Implementation.
- Guard against leakage. If train and test samples could overlap through labels, event windows, or feature construction, exclude overlapping observations and consider a time buffer between train and test blocks to reduce contamination from serial dependence Cross-Validation for Time Series, Explained | Quant MemoTime-Series Cross-Validation Explained | Quantitative Finance | BondStats.
- Evaluate across all folds. Aggregate out‑of‑sample metrics across test blocks; report central tendency and dispersion, not just the stitched equity curve Walk-Forward Analysis for Trading Strategies | Backtest.aiTime series cross-validation: an R example – Rob J Hyndman.
- Check stability. Track which parameters were selected in each fold and how sensitive performance is to W, H, and S; prefer broad plateaus over narrow peaks Walk-Forward Analysis for Trading Strategies | Backtest.ai.
Parameter stability: how to detect robustness vs noise#
Parameter stability is the degree to which your chosen settings (lookbacks, thresholds, hyperparameters) remain consistent across folds. Large, erratic swings in “optimal” values often indicate you are fitting to noise specific to each window, while clusters around similar values suggest a more robust signal Walk-Forward Analysis for Trading Strategies | Backtest.ai. Some research proposes double out‑of‑sample and walk‑forward techniques to assess robustness across different window choices, reinforcing the value of checking parameter behavior under multiple configurations A novel approach to trading strategy parameter optimization using double out-of-sample data and walk-forward techniques.
Diagnostics you can use:
- Per‑fold parameter trace: plot the selected parameter set over time; look for whipsawing vs clustering Walk-Forward Analysis for Trading Strategies | Backtest.ai.
- Heatmaps across (W, H): visualize performance when sweeping window sizes to see whether performance sits on a plateau or a spike Walk-Forward Analysis for Trading Strategies | Backtest.aiA novel approach to trading strategy parameter optimization using double out-of-sample data and walk-forward techniques.
- Cross‑fold dispersion: summarize median and interquartile range of performance metrics for the top N parameter sets, not just the single best per fold Walk-Forward Analysis for Trading Strategies | Backtest.ai.
Realistic decision rules and leakage control#
Walk‑forward results are only as honest as the decisions they simulate. Keep these rules tight:
- No look‑ahead at any stage. Feature transformations, target construction, hyperparameter selection, and any preprocessing must be fit strictly within the current train window Cross-Validation for Time Series, Explained | Quant MemoTime-Series Cross-Validation Explained | Quantitative Finance | BondStats.
- Align the test horizon with the trade horizon. If your rule acts on weekly closes, backtest in weekly blocks, not single‑step daily forecasts stitched into a weekly decision Time series cross-validation: an R example – Rob J HyndmanTime Series Cross-Validation: Techniques & Implementation.
- Avoid overlap contamination. If events or labels span multiple bars (e.g., using forward returns over k days), prevent those windows from leaking into training; use non‑overlapping splits and, when needed, a short time buffer between train and test segments to reduce dependence spillover Cross-Validation for Time Series, Explained | Quant MemoTime-Series Cross-Validation Explained | Quantitative Finance | BondStats.
- Roll the origin, then refit. After each test block completes, advance the windows, refit on the new train window, and repeat until you reach the end of history Time series cross-validation: an R example – Rob J HyndmanWalk-Forward Analysis for Trading Strategies | Backtest.ai.
An educational example to test with walk‑forward#
Below is a simple, measurable setup to demonstrate walk‑forward mechanics. It is an educational example, not a recommendation or signal.
Setup definition (hypotheses to test):
- Market and timeframe: liquid index future or ETF on daily bars.
- Entry hypothesis: trend‑pullback. Go long when price is above an n‑day moving average and closes back above the average after a pullback. Short side symmetrical. Parameters n and pullback depth are to be selected in training.
- Invalidation hypothesis: the signal is wrong if price closes m% beyond the pullback low (long) or high (short) within H; exit at stop.
- Exit hypothesis: take profit at a risk‑multiple or when a timed exit of t days is reached; whichever comes first.
- Position sizing: constant fraction of capital per trade, sized so the per‑trade risk is consistent across folds (sizing logic is part of the strategy and must be fit using only train‑window risk estimates) Cross-Validation for Time Series, Explained | Quant MemoTime-Series Cross-Validation Explained | Quantitative Finance | BondStats.
What could make it fail: sudden regime shifts, structural breaks, or parameter choices that are highly unstable across folds (e.g., the selected n jumps widely) Walk-Forward Analysis for Trading Strategies | Backtest.aiBacktesting Quantitative Trading Strategies: From Research Bias to Production Reality | Ernie’s Leisure Code.
Suggested journal tags to track: setup=trend‑pullback; regime=up/down/sideways; volatility=low/medium/high; reason‑to‑enter=pullback‑to‑MA; reason‑to‑exit=stop/time/profit; anomaly=data‑gap/leakage‑check; WFA‑fold=ID.
Reproducible walk‑forward backtest plan#
- Data partitioning. Choose rolling windows. Start with W=3 years of daily bars; test horizon H=1 month; step S=H (non‑overlapping) Walk-Forward Analysis for Trading Strategies | Backtest.aiTime series cross-validation: an R example – Rob J Hyndman.
- Per‑fold fitting. Within each train window, grid‑search n in 20, 50, 100; pullback depth in 1%, 2%, 3%; stop m in 1.5% or 2%; exit t in 5, 10, 20 trading days. Select by a validation rule inside the train window only (e.g., a split of the train, or expanding walk within the train) to avoid peeking into the test block Time series cross-validation: an R example – Rob J HyndmanCross-Validation for Time Series, Explained | Quant Memo.
- Transform discipline. Any normalization or volatility scaling must be estimated on the train window and applied to the subsequent test block without refitting Cross-Validation for Time Series, Explained | Quant MemoTime-Series Cross-Validation Explained | Quantitative Finance | BondStats.
- Leakage control. If labels use forward k‑day returns to detect exits, ensure those k‑day spans in the test block do not overlap the train block; apply a small buffer if needed Cross-Validation for Time Series, Explained | Quant MemoTime-Series Cross-Validation Explained | Quantitative Finance | BondStats.
- Execution assumptions. Use consistent rules for slippage and fees across folds; do not let them vary with knowledge of future liquidity.
- Metrics. For each test block, record trade count, hit rate, average win/loss, return distribution quantiles, drawdown stats, and exposure. Aggregate across folds with medians and dispersion, not just a stitched equity curve Walk-Forward Analysis for Trading Strategies | Backtest.aiTime series cross-validation: an R example – Rob J Hyndman.
- Stability report. Log the chosen parameters per fold and summarize their variability; produce a (W, H) sensitivity table to check for plateaus Walk-Forward Analysis for Trading Strategies | Backtest.aiA novel approach to trading strategy parameter optimization using double out-of-sample data and walk-forward techniques.
Examples of window schemas and retraining cadence#
Where walk‑forward shines (and where it doesn’t)
Strengths
- ✓Multiple honest out‑of‑sample evaluations instead of a single lucky split (Source: Walk forward optimization) (Source: Walk-Forward Analysis for Trading Strategies | Backtest.ai) (Source: Time series cross-validation: an R example – Rob J Hyndman).
- ✓Simulates real deployment by fitting only on past and testing on the immediate future (Source: Walk forward optimization) (Source: Walk-Forward Analysis for Trading Strategies | Backtest.ai).
- ✓Reveals parameter stability (or instability) across regimes and retraining cycles (Source: Walk-Forward Analysis for Trading Strategies | Backtest.ai).
- ✓Works with both simple rule‑based strategies and statistical/ML models (Source: Walk forward optimization) (Source: Walk-Forward Analysis for Trading Strategies | Backtest.ai).
Limitations
- —Still vulnerable if parameters are tuned too aggressively inside each fold; sensitivity analysis is mandatory (Source: Walk-Forward Analysis for Trading Strategies | Backtest.ai) (Source: A novel approach to trading strategy parameter optimization using double out-of-sample data and walk-forward techniques).
- —Results depend on chosen W, H, and S; poor choices can under‑ or overstate robustness (Source: Time series cross-validation: an R example – Rob J Hyndman) (Source: Time Series Cross-Validation: Techniques & Implementation).
- —Expanding windows may entrench stale regimes; rolling windows may be too noisy for long‑horizon ideas (Source: Backtesting Quantitative Trading Strategies: From Research Bias to Production Reality | Ernie’s Leisure Code).
- —Requires disciplined data handling to avoid leakage (feature fitting, overlapping labels) (Source: Cross-Validation for Time Series, Explained | Quant Memo) (Source: Time-Series Cross-Validation Explained | Quantitative Finance | BondStats).
FAQ: walk‑forward analysis for trading#
How is walk‑forward analysis different from generic time‑series cross‑validation?
They answer different questions. Cross‑validation for time series generalizes the idea of training only on the past and testing on later data; walk‑forward analysis is a practical instantiation where you repeatedly fit on a past window and test on the immediately following block (rolling origin) Time series cross-validation: an R example – Rob J HyndmanCross-Validation for Time Series, Explained | Quant MemoWalk forward optimization.
How do I choose W (train length) and H (test horizon)?
Pick W large enough to estimate parameters with tolerable noise, and H to match how long you would trade a frozen model before refitting. Then sweep a few plausible (W, H) pairs and report both performance and parameter stability across them rather than trusting a single choice Walk-Forward Analysis for Trading Strategies | Backtest.aiBacktesting Quantitative Trading Strategies: From Research Bias to Production Reality | Ernie’s Leisure CodeTime series cross-validation: an R example – Rob J Hyndman.
What are overlap and time buffers in time‑series validation?
If labels or event windows span multiple bars, samples near the train/test boundary can leak information. To reduce contamination, exclude overlapping observations and insert a short time buffer before/after test blocks so training doesn’t peek into future‑related structure Cross-Validation for Time Series, Explained | Quant MemoTime-Series Cross-Validation Explained | Quantitative Finance | BondStats.
Should steps be non‑overlapping (S=H) or smaller?
It is usually better to step by H for clarity, but smaller steps can give denser evaluation. Just ensure strict temporal ordering and consistent accounting so overlapping test blocks don’t double‑count trades or leak information Time series cross-validation: an R example – Rob J HyndmanTime Series Cross-Validation: Techniques & Implementation.
Should I aggregate results across folds or focus on the stitched equity curve?
Report performance aggregated across all out‑of‑sample folds (e.g., medians and dispersion), and also show how chosen parameters vary across folds. This guards against reading too much into one lucky period Walk-Forward Analysis for Trading Strategies | Backtest.aiTime series cross-validation: an R example – Rob J Hyndman.
Sources#
- Walk forward optimization — en.wikipedia.org
- Walk-Forward Analysis for Trading Strategies | Backtest.ai — backtest.ai
- Backtesting Quantitative Trading Strategies: From Research Bias to Production Reality | Ernie’s Leisure Code — ernie55ernie.github.io
- Time series cross-validation: an R example – Rob J Hyndman — talks.robjhyndman.com
- What is walk-forward analysis? | Lagias — lagias.com
- Time Series Cross-Validation: Techniques & Implementation — itechguides.com
- A novel approach to trading strategy parameter optimization using double out-of-sample data and walk-forward techniques — arxiv.org
- Cross-Validation for Time Series, Explained | Quant Memo — quantmemo.com
- Time-Series Cross-Validation Explained | Quantitative Finance | BondStats — bondstats.org
KEEP READING
Strategies11 min read
Dealer Gamma, 0DTE, and Expiry Pin Risk Explained
Plain-language definitions of dealer gamma and 0DTE, how expiry can look like pinning, and a vendor-agnostic, invalidatable test you can run.
Read post
Strategies6 min read
A disciplined way to backtest gap-and-go setups
Backtest the gap and go strategy without hindsight: define universe, time‑stamp catalysts, model the opening auction, and predeclare entries and exits.
Read post
Strategies8 min read
How to test a trend-pullback strategy
Turn a vague pullback idea into a testable trend pullback strategy with measurable rules, ATR/Fibonacci options, and a reproducible backtest plan.
Read post