Strategies8 min read
How to Measure Trend Pullback Duration
Learn how to measure pullback duration in trading with consistent episode labels, bar and clock-time records, and predefined comparison bands.
By TerraTrade Team

What pullback duration can—and cannot—tell you#
A pullback-duration measurement answers a narrow question: from the point you label as the start of a pullback episode to the point you label as its end, how many chart bars passed, and how much clock time elapsed? The answer depends on the labeling rule and chart settings. There is no single number of bars that defines a “normal” pullback across markets, timeframes, and chart types. CME Group describes some continuation patterns as short-lived and others as potentially lasting a long time; those are qualitative descriptions of particular patterns, not a universal duration rule. https://www.cmegroup.com/education/courses/technical-analysis/trend-and-continuation-patterns
The aim here is to make your own observations comparable. You will record the settings behind each comparison, label each episode once, count it consistently, note its timestamp-based elapsed time, and summarize completed episodes in bands chosen before tallying. This is a measurement worksheet—not an entry signal, a complete trading strategy, or evidence that duration predicts what price will do next.
Set the comparison rules first#
Before logging episodes, define the group you intend to compare. Keep the instrument or market, chart type, bar interval or construction rule, timezone, and session basis visible in your worksheet. A group might consist of one instrument on one time-based interval with one specified session setting. If you change those settings, start a separate group or clearly mark the change.
Fill in these fields once for each comparison group. A time-based bar interval gives a bar count an interval-based interpretation, but elapsed clock time can differ when sessions close or when there are gaps. On non-time-based charts, do not convert bar count into clock time by multiplying it by a presumed interval; use the recorded timestamps instead.
| Setting | Record this | Why it matters |
|---|---|---|
| Market | Instrument or market label | Keeps the observations tied to the same comparison group. |
| Chart construction | Time-based or other bar-construction rule | A bar count does not mean the same thing across different constructions. |
| Interval or bar rule | For example, the time interval or tick threshold | Makes the bar-count basis explicit. |
| Time settings | Timezone and session basis | Makes timestamps and gaps easier to interpret. |
| Counting convention | Whether start and end bars are both included | Prevents off-by-one differences between episodes. |
| Duration bands | Ranges in bars, clock time, or both | Predefines categories before you summarize the sample. |
Use the same sequence for every chart in the group. The example counting convention below includes both endpoint bars; the specific choice matters less than consistency and clear documentation.
- Freeze the comparison group. Record the market, chart construction, interval or bar rule, timezone, session basis, and counting convention.
- Write your episode-labeling rule in plain language. Specify how you mark the start, how you mark the end, and how you handle a move that appears to continue or resume before the episode is clearly complete.
- Assign one episode number to each start-to-end interval. Do not add a new episode for each bar within the same interval. If your rule cannot resolve a case, mark it uncertain and keep a note rather than improvising.
- Record the start and end bar identifiers or timestamps. Mark whether the episode is complete under your rule. An episode still in progress is not a completed duration.
- Count elapsed bars using the same convention every time. One workable convention is to include both the start bar and the end bar. Under that convention, an episode running from bar 5 through bar 8 occupies four bars. If you choose a different convention, document it and apply it consistently.
- Calculate clock elapsed time from the recorded start and end timestamps, and note any overnight, weekend, or session gap separately. Elapsed clock time and time actively represented by bars are not necessarily interchangeable.
- Assign each completed episode to a duration band you defined in advance. Keep incomplete episodes in a separate list rather than placing them into completed-duration summaries.
- Review a sample of labels against the written rule. If you revise the rule, document the revision and re-label the affected observations rather than mixing definitions without notice.
Copy rows as needed. Include timestamps with the timezone you recorded in the group settings. Use the notes column for borderline labels, missing data, or a gap that affects how clock time compares with the bar count.
| Episode | Start bar / date-time | End bar / date-time | Complete? | Elapsed bars | Clock elapsed | Gap noted? | Duration band | Labeling notes |
|---|---|---|---|---|---|---|---|---|
| 1 | ||||||||
| 2 | ||||||||
| 3 | ||||||||
| 4 | ||||||||
| 5 |
Bands are organizational buckets, not validated cutoffs or forecasts. For a small exploratory sample, broad bands may be easier to interpret than many narrow categories. The important point is to set them before you see the tally, so the categories are not adjusted to create a preferred-looking summary.
- Choose bands that are useful for the question you are asking, and write the boundaries down before tallying. The source material does not prescribe standard pullback-duration bands.
- Use non-overlapping ranges with an explicit rule for boundary values. For example, specify whether the upper endpoint belongs in the first band or the next.
- Choose whether the primary comparison is in bars or clock time. You can record both, but do not treat equal bar counts on different intervals as equal elapsed time.
- Count only completed episodes in the band summary. Report the number of completed observations alongside each share so the reader can see the sample size.
- Calculate each band’s share as completed episodes in that band divided by all completed episodes in the comparison group. Do not include incomplete episodes in that denominator.
Worksheet formula: band share = completed episodes in the band ÷ all completed episodes in this comparison group. The formula describes the observed sample only; it does not estimate a future outcome.
| Predefined band | Completed episodes | Share of completed episodes |
|---|---|---|
| Band 1: ___ to ___ bars (or ___ to ___ clock time) | ||
| Band 2: ___ to ___ bars (or ___ to ___ clock time) | ||
| Band 3: ___ to ___ bars (or ___ to ___ clock time) | ||
| Band 4: ___ or more bars (or ___ or more clock time) | ||
| Total completed episodes included | 100% of included completed episodes |
If you later want to test whether duration relates to a trading outcome, define that outcome, entry, invalidation, exit, costs, and comparison method as a separate strategy experiment. Keep the duration-labeling rules fixed, and do not infer predictive value from a frequency table alone.
- Hypothesis to examine: within one consistently defined comparison group, completed pullback episodes can be summarized by their labeled duration in bars and clock time. This is a measurement hypothesis, not a claim about profitability or future price movement.
- Setup definition for the worksheet: specify the chart conditions and written start/end labeling rule. Do not add entry, invalidation, or exit rules unless you are designing a separate trading-strategy test.
- Conditions that weaken comparability: inconsistent labels, changed chart settings, missing timestamps, unrecorded session gaps, or mixing completed and incomplete episodes.
- Reproducible plan: choose the comparison group and bands first; label a defined historical sample; log every eligible episode, including ambiguous cases; calculate completed-episode counts and shares; then repeat the labeling on a separate sample using the unchanged rules.
- Journal tags: pullback-duration, instrument, chart-interval, chart-type, session-basis, labeling-rule-version, completed, incomplete, ambiguous, and duration-band. Use tags to locate records, not to imply that a band is a trade signal.
Frequently asked questions#
How many bars should a pullback last?
There is no universal pullback duration established here. The observed duration depends on the instrument, chart construction, interval, session, and the rule used to label an episode. CME’s pattern descriptions are qualitative and concern particular patterns, not a general bar-count threshold. https://www.cmegroup.com/education/courses/technical-analysis/trend-and-continuation-patterns
Do I count the start and end bars?
Choose one convention and write it down. Including both start and end bars is a practical option; under that method, bars 5 through 8 count as four bars. Apply the same method to every episode.
Should I use bars or clock time?
Record both where possible, but keep them distinct. Bar count describes the number of bars under your counting convention; clock elapsed time comes from start and end timestamps. Session closures and gaps can make those measures diverge.
What duration bands should I use?
Choose and record the band boundaries before tallying. There are no standard duration bands prescribed by the cited material; these categories organize your observations and are not trading cutoffs.
How do I handle a pullback that has not ended?
Keep an in-progress episode separate from completed durations. Do not assign it to a completed-duration band or include it in the denominator for completed-episode shares.
Does a duration band predict what happens next?
No. A duration summary describes the episodes in the labeled sample. It does not establish that duration predicts continuation or improves a trading outcome; that would require a separately specified test.
The practical takeaway#
To measure pullback duration in trading, make the episode boundaries and counting convention explicit, record timestamps as well as bars, separate incomplete episodes, and compare completed observations only within a clearly defined group. Predefined bands can make the log easier to review, but they are descriptive categories—not universal market rules or stand-alone trading signals.
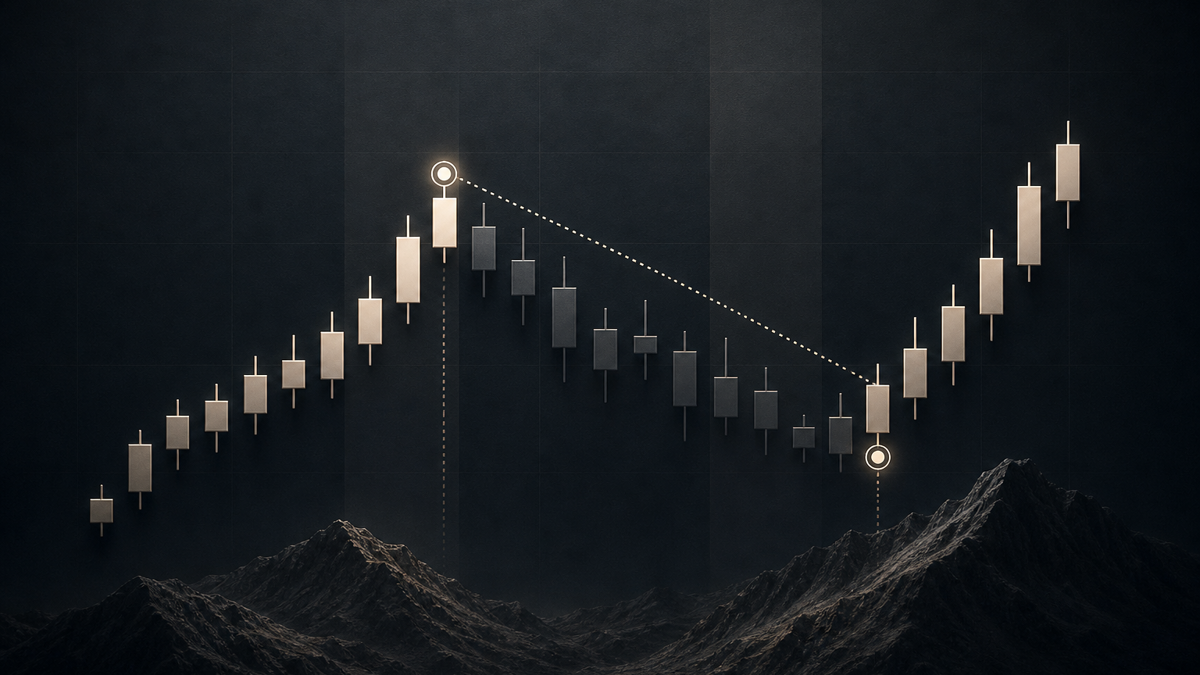
Build and use the pullback-duration worksheet#
Use the comparison-group settings table to fix your chart context, then log each episode in the worksheet and summarize completed durations in your predefined bands. Keep incomplete episodes separate until your labeling rule declares them finished.
Sources#
- https://www.cmegroup.com/education/courses/technical-analysis/trend-and-continuation-patterns — cmegroup.com
- https://www.cmegroup.com/education/courses/trading-and-analysis/technical-analysis — cmegroup.com
- https://www.cmegroup.com/content/dam/cmegroup/education/files/educational-inventory.pdf — cmegroup.com
- https://www.sec.gov/files/2026_TM_Overnight_Trading_Roundtable_Memo_090926.pdf — sec.gov
- https://www.finra.org/sites/default/files/2026-03/FINRA_Data_Delivery_User_Guide_version_18.0.pdf — finra.org
- https://www.finra.org/sites/default/files/Industry/p009847.pdf — finra.org
- https://syndication.finra.org/content/are-you-checking-your-trade-confirmations — syndication.finra.org
- https://www.sec.gov/featured-topics/market-structure-analytics/market-activity-report-methodology — sec.gov
- https://syndication.finra.org/content/keep-recordkeeping — syndication.finra.org
- https://www.finra.org/sites/default/files/NACDecision/p011541_0.pdf — finra.org
- https://www.sec.gov/tm/investor-alerts-bulletins/afterhourtrading.pdf — sec.gov
- https://www.finra.org/sites/default/files/RuleFiling/p000855.pdf — finra.org
- https://www.sec.gov/Archives/edgar/data/1692652/000169265226000005/primary_doc.xml — sec.gov
- https://syndication.finra.org/content/tax-time-topics-cost-basis-what-you-need-know — syndication.finra.org
- https://www.sec.gov/files/investor/pubs/afterhours.htm — sec.gov
- https://www.sec.gov/newsroom/press-releases/2000-151-stock-markets-agree-distinguish-after-hours-regular-session-trades-t-modifier — sec.gov
KEEP READING

Strategies7 min read
Which Session Should Your Futures VWAP Use?
Choose and document a futures VWAP session boundary by recording reset time, time zone, included hours, and break handling.
Read post
Strategies9 min read
Audit Higher-Timeframe Indicator Timing
Audit higher-timeframe indicator lookahead bias in an intraday backtest with a timestamp worksheet, eligibility checks, and reproducible steps.
Read post
Backtesting7 min read
Build a Historical Stock Universe for Backtesting
Build a date-bounded historical stock universe with a worksheet for membership, ticker changes, listing status, and delisting checks.
Read post